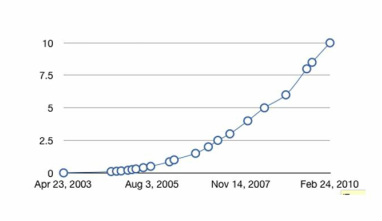
The data appears to be an exponential function. 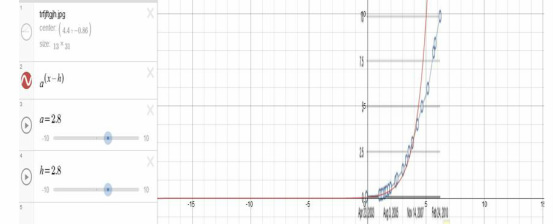 The function of this graph is y=2.8^(x-2.8) Domain: x is greater than or equal to zero Range: y is greater than or equal to zero The negatives don't matter because you cant have negative downloads. if you try to extend the data points, it wont make a difference because the range and domain will be the same.
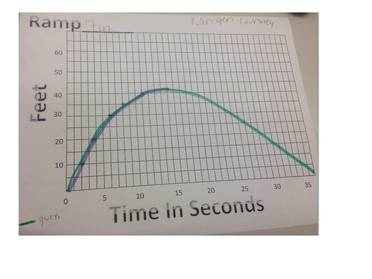
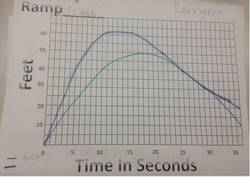
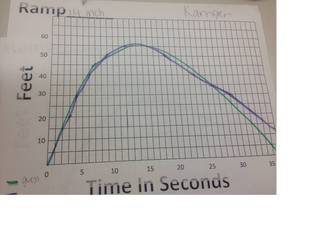
A. On the 21 inch graph, my prediction was off by alot in the beginning and then was closer together after it rolled back down the hill. On the 14 inch and the 7 inch graph my prediction was fairly close to the actual. B. The zeros on the graph represent the starting point and the ending point. C. They all start at zero, but end up in different spots when they end. The 21 inch graph has the highest maximum, next the 14 inch, and the lowest maximum is the 7 inch graph. The maximum is the furthest away from the ramp and the minimum is where the skateboard is closest to the ramp. The skateboard on the 7inch, doesnt roll back down. D. The graph is rising the fastest right from zero because it has the most speed at that time. It falls the fastest right when it starts rolling back because its getting speed again.
(a) the height of the flag goes up at a constant rate. (b) the height increases quickly, then slows down. (c) increases, stops and repeats. This one is most likely because you pull with one arm at a time, switch and repeat. (d) the height increases slowly then speeds up. (e) the height increases slowly, speeds up, and slows again. (f) the height increases rapidly. This one is the least likely because this graph means it woudn't take any time to put the flag up. and it takes time. 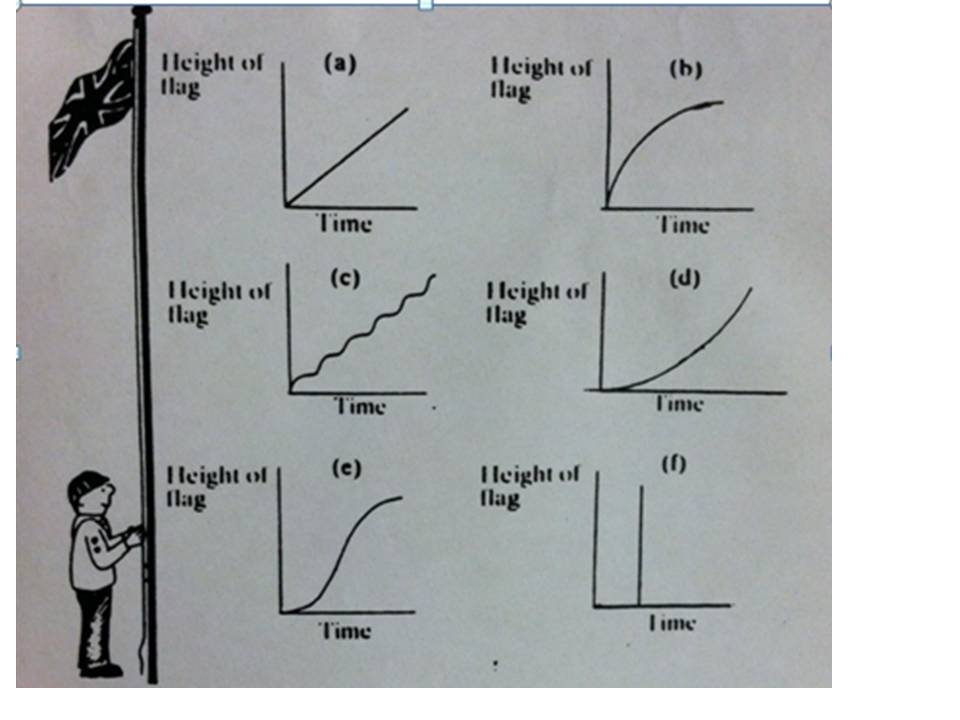
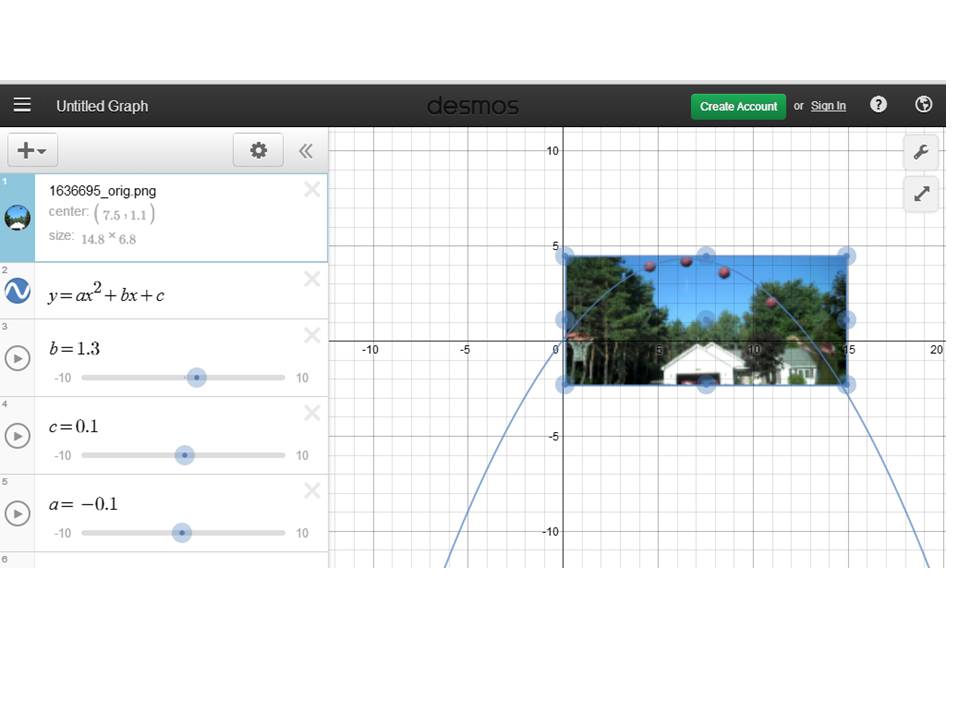
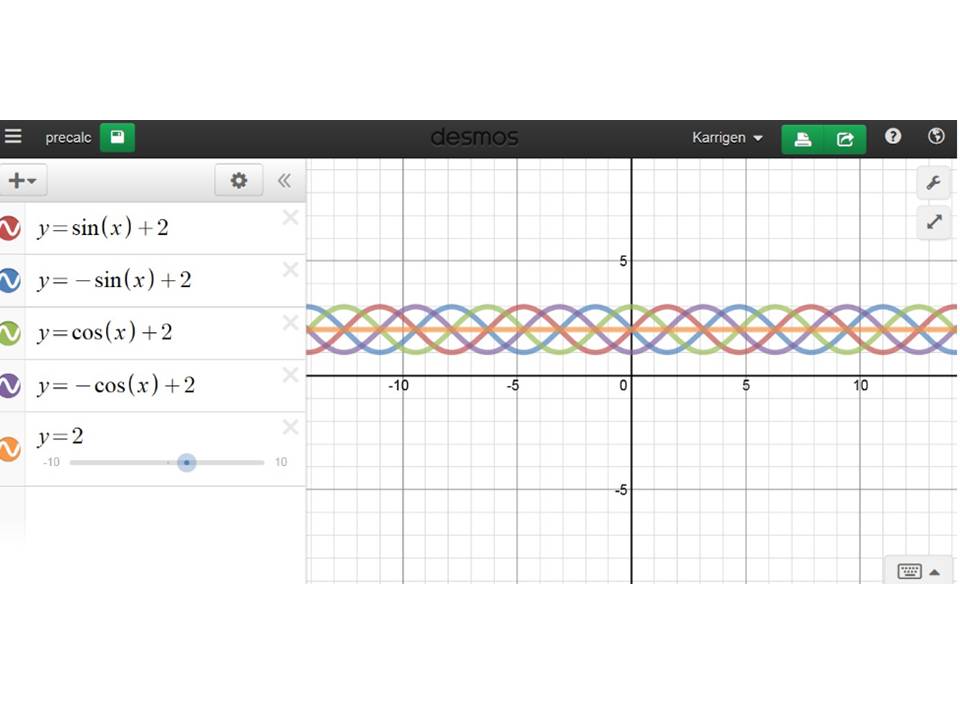
I used multiple equations to create this graph. I used positive and negative of the same function to make a reflection of each other. I used {x<0} and {x>0} to show only half of the function. 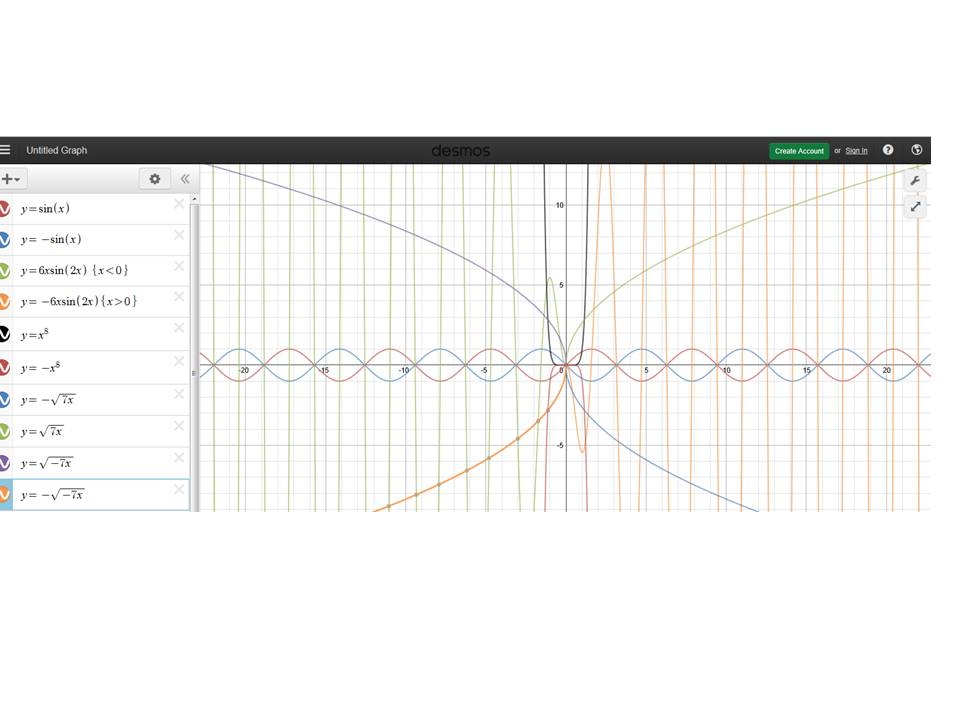
| AuthorWrite something about yourself. No need to be fancy, just an overview. ArchivesMarch 2015 Categories |
 RSS Feed