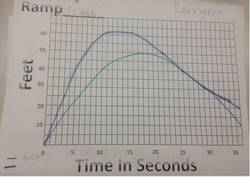
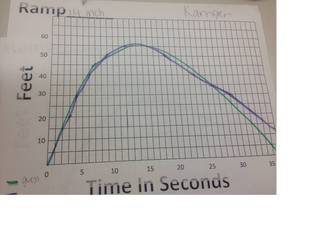
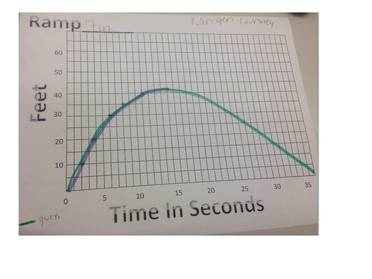
A. On the 21 inch graph, my prediction was off by alot in the beginning and then was closer together after it rolled back down the hill. On the 14 inch and the 7 inch graph my prediction was fairly close to the actual.
B. The zeros on the graph represent the starting point and the ending point.
C. They all start at zero, but end up in different spots when they end. The 21 inch graph has the highest maximum, next the 14 inch, and the lowest maximum is the 7 inch graph. The maximum is the furthest away from the ramp and the minimum is where the skateboard is closest to the ramp. The skateboard on the 7inch, doesnt roll back down.
D. The graph is rising the fastest right from zero because it has the most speed at that time. It falls the fastest right when it starts rolling back because its getting speed again.
| 
|
 RSS Feed