| For the first piece of art, I used the cosine polar graph equation and the sine polar graph equation to create three different flowers. I then used sliders to change the design and the size of the flowers. The different coefficients that are in the sliders, make the design and size of the graph. | 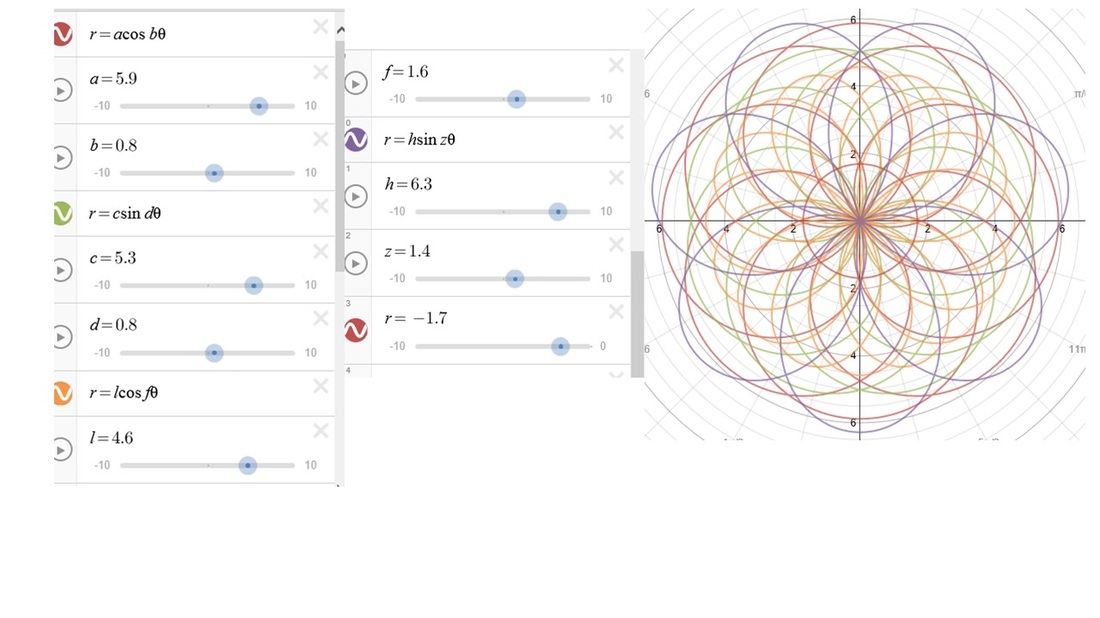
|
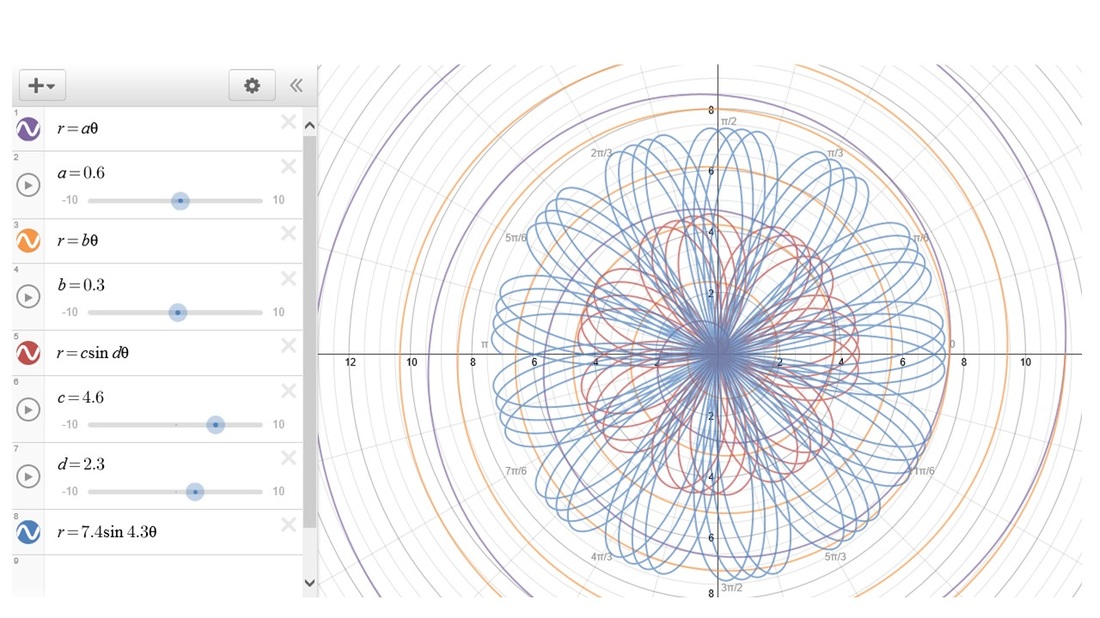
| In this piece of art, the graphs are based off of r=atheta and r=asinbtheta I used r=atheta to create two different spirals. I used r=asinbtheta to create two flowers. I then used sliders to change the size and design of the flowers and spirals. The different coefficients that are in the sliders, make the design and size of the graph. |
| For the last piece of art I used Gifsmos.com to create an animation. I used the polar graphs of sine and cosine to make the flowers. I used theta to create spirals. I set 'r' equal to a coefficient to create the circles. I made the spirals opposite of each other. I used sliders and recorded it to create an animation. The different coefficients that are in the sliders, make the design and size of the graph. | *My computer would not save the animation so I recorded it off my phone. Sorry for the bad quality* |
The graphs I created at the beginning of the trimester were not as complex as the ones at the end of the trimester. Trig taught me different, yet interesting graphs. It has also taught me how to make more complex graphs.
 RSS Feed